
1. Which additional data did you gather to inform your thinking on the problem?
From the data I pulled and reviewed, I used the following reports to focus on for a deeper analysis of root causes:
2. After analyzing all data, what do you believe are the root causes of the problem you identified? Comment on: organization culture, external factors, organizational structure, student demographics, instruction and preparation, and curriculum.
After analyzing the data, the root causes stem from several factors. First, considering student factors, I found that students receiving most of the referrals for defiance or disruption were African Americans, followed by Hispanic or Latino students. Seventh grade teachers when interviewed reported that students lacked the motivation and interest in the subject matter or during the period where the referral was given. Most students receiving referrals were from socioeconomically disadvantaged backgrounds. I found that more referrals occurred in classes after lunch and afterschool. Looking into external factors, I found that overall our site has low parent involvement. This is particularly the case for English Language Learners and for African American students. In terms of organizational structures, a lack of collaboration time for 7th and 8th grade teachers to focus as a group on Positive Behavior Inventions and Support (PBIS) may be a contributing factor. Where sixth grade teachers are together as part of a village and have more collaboration and planning time together, 7th and 8th grade teachers have multiple preps and are spread across grade levels for both high school and middle school. For my next steps, I still need to look at instruction and curriculum for my target group. I still need to meet with the ELL coordinator to review CELDT scores (look at trends related to subgroups and whether these have been consistent, gotten better or worse), and I need to look at additional demographics at the middle school level. Our site SARC report only includes overall school demographics in terms of number of African American and Hispanic/Latino students overall but not a grade level breakdown. Finally, I recent post from our High School Graduation coach indicated that 99 sixth graders, 138 seventh graders, and 176 8th graders are on academic probation. I’m planning to dig deeper into the demographic breakdown of students currently on academic probation.
3. Based on an outcome you would like to attain for the target group, write 1 goal and 2-3 objectives that support that goal (Create a SMART Goal—Specific, measurable, attainable, realistic, timely).
Goal 1: Seventh grade African American and Hispanic/Latino students will reduce their referrals.
Objective A: Subgroup referrals for African American students will be at least 30 percent lower than this year’s reported period and subgroup Hispanic/Latino students will be at least 10 percent lower.
Objective B: The rate of referrals for grades 6-8 after lunch will be at least 40% lower.
From the data I pulled and reviewed, I used the following reports to focus on for a deeper analysis of root causes:
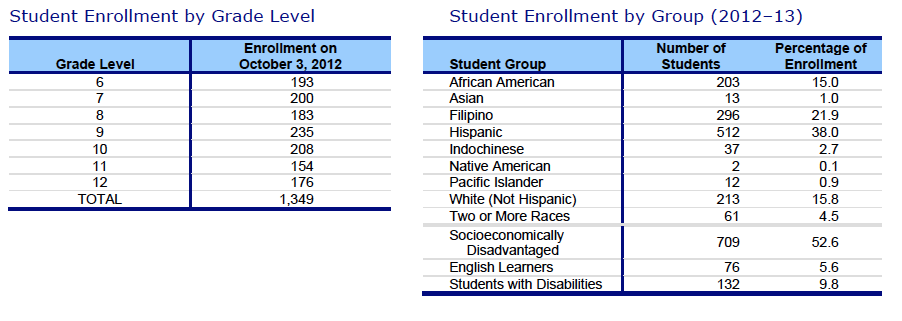
- SCPA SARC Report showing student enrollment by grade level and student enrollment by group.
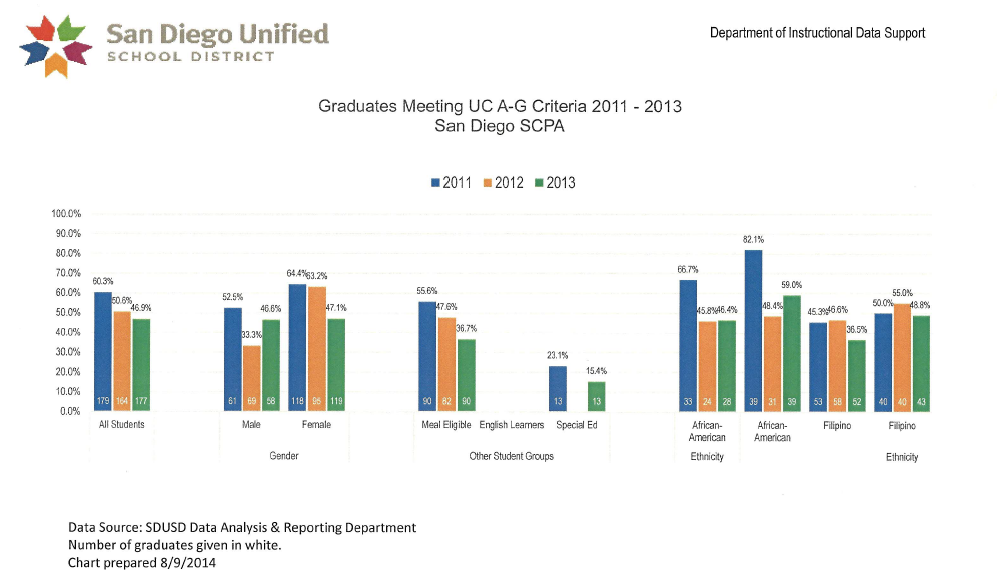
- Graduates Meeting UC A-G Criteria (Next steps: look at factors that might be influencing the decrease in attainment of A-G?). I suspect some of this will be related to teacher turnover, transition to new technologies, and curriculum and instruction.
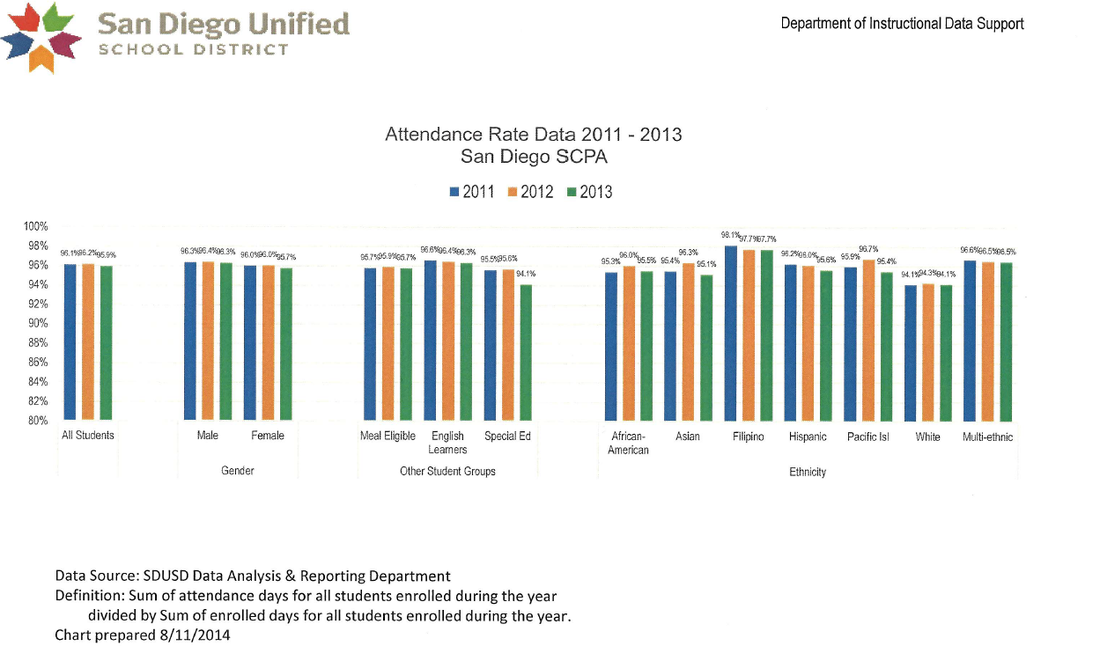
- Attendance
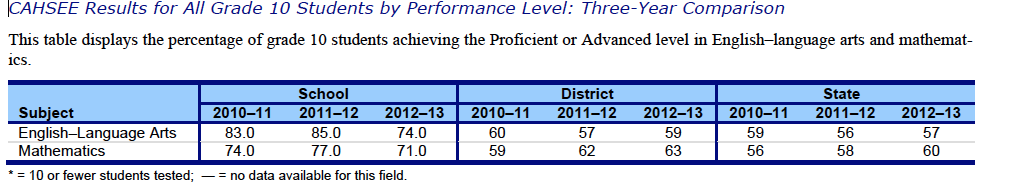
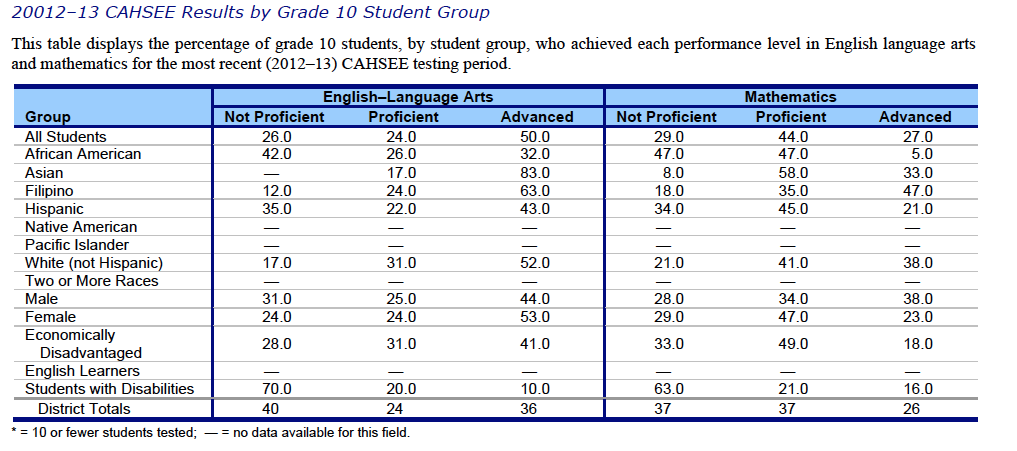
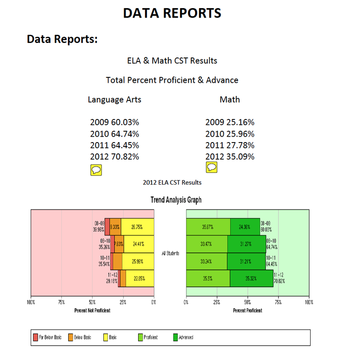
- ELA and Math CST results showing demographic groups
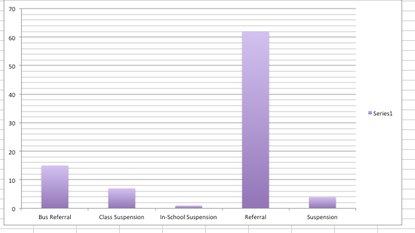
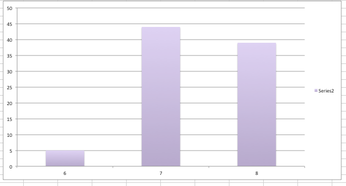
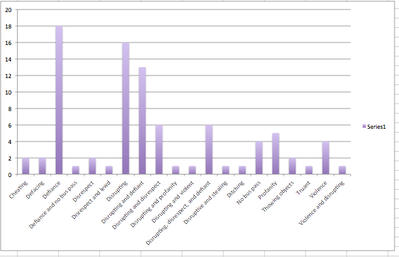
- Positive Behavior Interventions and Support (PBIS) Data on referrals for students in grades 6-8 and data indicating the reasons for referrals.
2. After analyzing all data, what do you believe are the root causes of the problem you identified? Comment on: organization culture, external factors, organizational structure, student demographics, instruction and preparation, and curriculum.
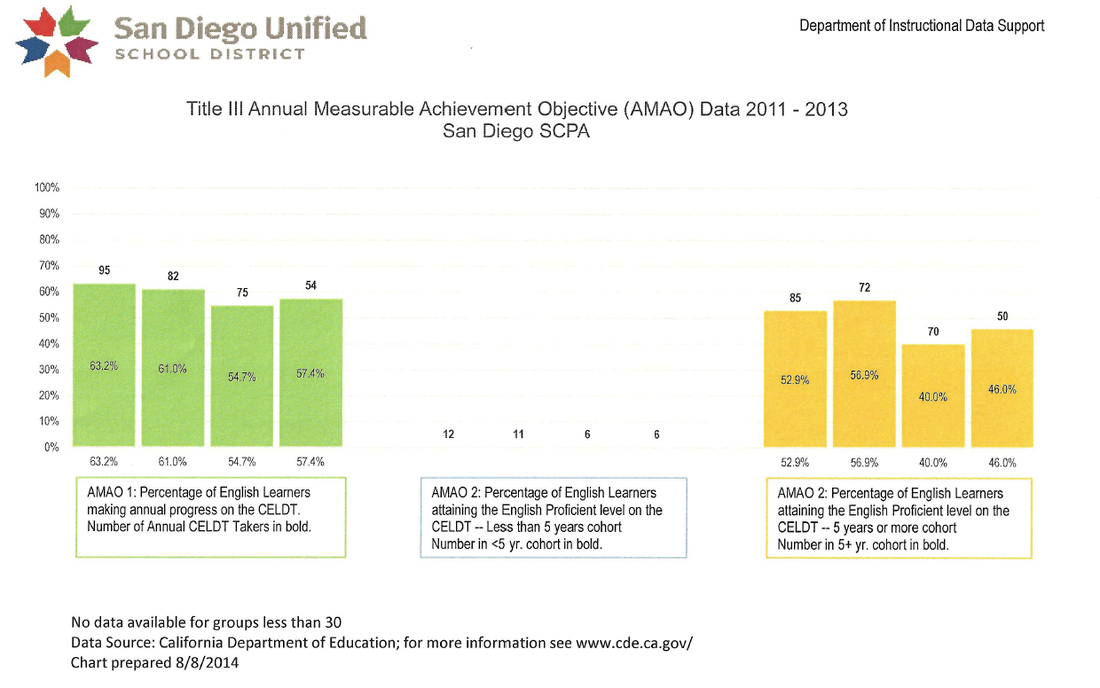
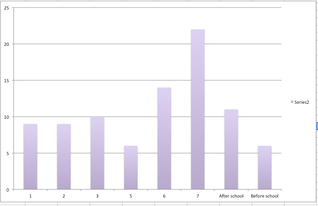
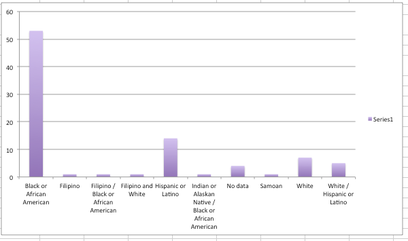
After analyzing the data, the root causes stem from several factors. First, considering student factors, I found that students receiving most of the referrals for defiance or disruption were African Americans, followed by Hispanic or Latino students. Seventh grade teachers when interviewed reported that students lacked the motivation and interest in the subject matter or during the period where the referral was given. Most students receiving referrals were from socioeconomically disadvantaged backgrounds. I found that more referrals occurred in classes after lunch and afterschool. Looking into external factors, I found that overall our site has low parent involvement. This is particularly the case for English Language Learners and for African American students. In terms of organizational structures, a lack of collaboration time for 7th and 8th grade teachers to focus as a group on Positive Behavior Inventions and Support (PBIS) may be a contributing factor. Where sixth grade teachers are together as part of a village and have more collaboration and planning time together, 7th and 8th grade teachers have multiple preps and are spread across grade levels for both high school and middle school. For my next steps, I still need to look at instruction and curriculum for my target group. I still need to meet with the ELL coordinator to review CELDT scores (look at trends related to subgroups and whether these have been consistent, gotten better or worse), and I need to look at additional demographics at the middle school level. Our site SARC report only includes overall school demographics in terms of number of African American and Hispanic/Latino students overall but not a grade level breakdown. Finally, I recent post from our High School Graduation coach indicated that 99 sixth graders, 138 seventh graders, and 176 8th graders are on academic probation. I’m planning to dig deeper into the demographic breakdown of students currently on academic probation.
3. Based on an outcome you would like to attain for the target group, write 1 goal and 2-3 objectives that support that goal (Create a SMART Goal—Specific, measurable, attainable, realistic, timely).
Goal 1: Seventh grade African American and Hispanic/Latino students will reduce their referrals.
Objective A: Subgroup referrals for African American students will be at least 30 percent lower than this year’s reported period and subgroup Hispanic/Latino students will be at least 10 percent lower.
Objective B: The rate of referrals for grades 6-8 after lunch will be at least 40% lower.
 RSS Feed