
 An Overview from May 2015 to June, 2016 —A Detailed Calendar, Monitoring, and Communication Plan Data to be Gathered throughout the year
** Please see Check-in #1 for Data Reports. ** Additional Data
Communicating Progress with Stakeholders
1) Describe how leadership, teachers, families and students will be involved in this process. What role will each play?
Leadership:
2) What are the interventions that you plan to implement based on your goals and objectives? Indicate interventions for students, faculty/staff, and families/communities and indicate whether they are focused on individual students, groups, grade levels, or whole school. Interventions for Middle School Students:
Families and Communities:
3) What type of support will be needed to carry this out? For example, time, professional development, materials, etc. Time:
References: Fisher, Douglas, Nancy Frey, and Ian Pumpian. How to create a culture of achievement in your school and classroom. ASCD, 2012. James-Ward, C., Fisher, D., Frey, N., & Lapp, N. (2013). Using Data to Focus Instructional Improvement, ASCD. 1. Which additional data did you gather to inform your thinking on the problem?
From the data I pulled and reviewed, I used the following reports to focus on for a deeper analysis of root causes:
2. After analyzing all data, what do you believe are the root causes of the problem you identified? Comment on: organization culture, external factors, organizational structure, student demographics, instruction and preparation, and curriculum. After analyzing the data, the root causes stem from several factors. First, considering student factors, I found that students receiving most of the referrals for defiance or disruption were African Americans, followed by Hispanic or Latino students. Seventh grade teachers when interviewed reported that students lacked the motivation and interest in the subject matter or during the period where the referral was given. Most students receiving referrals were from socioeconomically disadvantaged backgrounds. I found that more referrals occurred in classes after lunch and afterschool. Looking into external factors, I found that overall our site has low parent involvement. This is particularly the case for English Language Learners and for African American students. In terms of organizational structures, a lack of collaboration time for 7th and 8th grade teachers to focus as a group on Positive Behavior Inventions and Support (PBIS) may be a contributing factor. Where sixth grade teachers are together as part of a village and have more collaboration and planning time together, 7th and 8th grade teachers have multiple preps and are spread across grade levels for both high school and middle school. For my next steps, I still need to look at instruction and curriculum for my target group. I still need to meet with the ELL coordinator to review CELDT scores (look at trends related to subgroups and whether these have been consistent, gotten better or worse), and I need to look at additional demographics at the middle school level. Our site SARC report only includes overall school demographics in terms of number of African American and Hispanic/Latino students overall but not a grade level breakdown. Finally, I recent post from our High School Graduation coach indicated that 99 sixth graders, 138 seventh graders, and 176 8th graders are on academic probation. I’m planning to dig deeper into the demographic breakdown of students currently on academic probation. 3. Based on an outcome you would like to attain for the target group, write 1 goal and 2-3 objectives that support that goal (Create a SMART Goal—Specific, measurable, attainable, realistic, timely). Goal 1: Seventh grade African American and Hispanic/Latino students will reduce their referrals. Objective A: Subgroup referrals for African American students will be at least 30 percent lower than this year’s reported period and subgroup Hispanic/Latino students will be at least 10 percent lower. Objective B: The rate of referrals for grades 6-8 after lunch will be at least 40% lower. what type of student achievement data did you analyze? And what were the main findings generated from the analysis?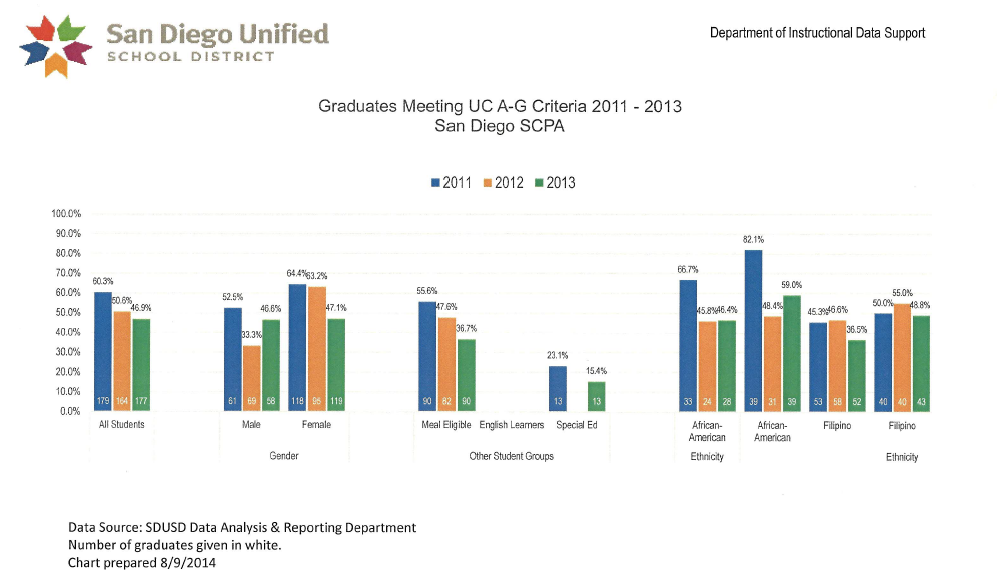 Graduates Meeting UC A-G Criteria 2011-2013 Fewer students are meeting UC A-G Criteria: Decrease from 60.3% in 2011 to 46.9% in 2013. African American students meeting UC A-G Criteria dropped significantly. 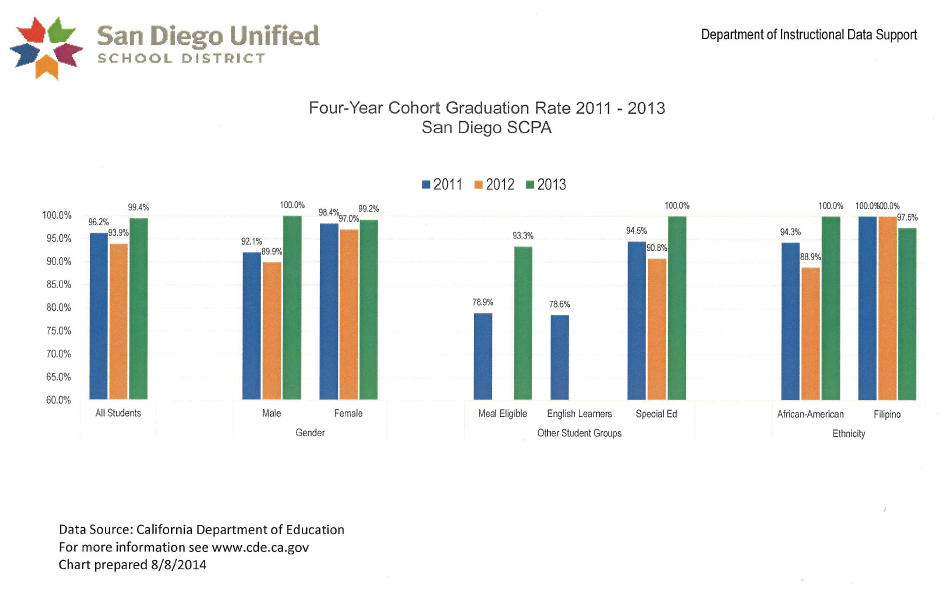 Four-Year Cohort Graduation Rate 2011-2013 Consistent 96% to 98% graduation rate. Also based on Single Plan for Student Achievement (SPSA) goals, SCPA exceeded the goal to increase the graduation rate to 98.2% by 2013. Graduation rate in 2013 increased to 99.4%. Factors contributing to this might be employment of graduation coach and implementation of credit recovery program. 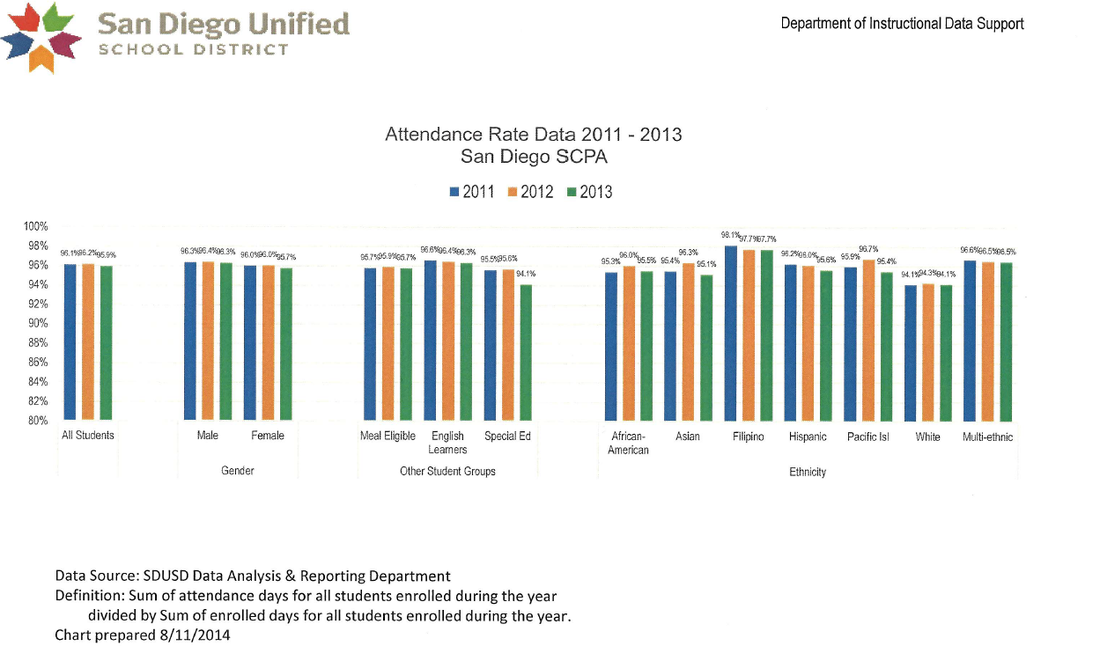 Attendance Rate Data 2011-2013 Consistent 96% attendance rate. 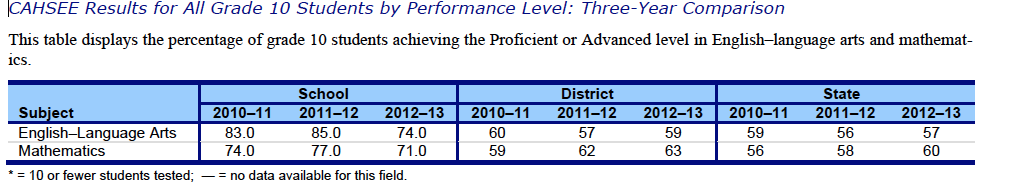 CAHSEE Results by Grade 10 Some inconsistency between SARC CAHSEE data shown above and data reported on SPSA. The SPSA report states that SCPA exceeded the 2011-2012 ELA CAHSEE Goal with 94% of 10th graders passing and 93% of 10 graders passing the MATH CAHSEE. The above report indicates a lower percentage (SARC Report, 2014). 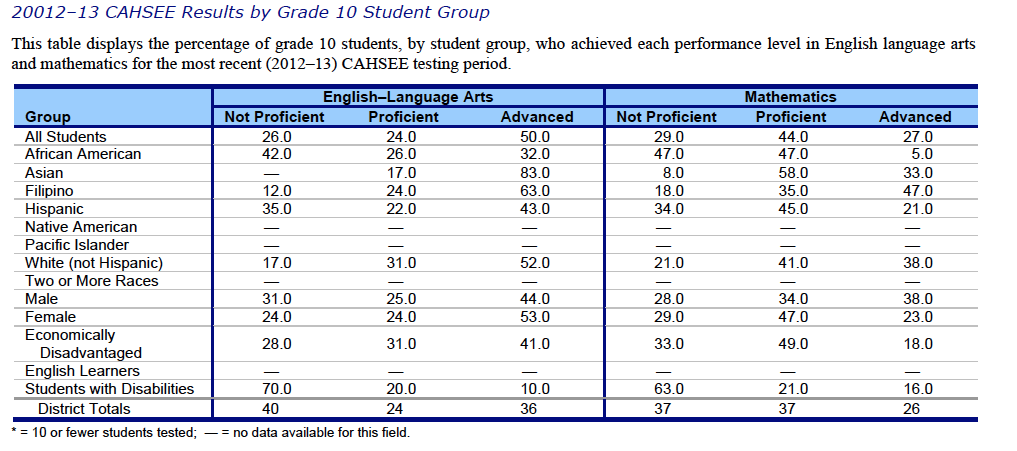 CAHSEE Results by Grade 10 Student Group A greater number of students who are African Americans and Students with Disabilities are not proficient (SARC Report, 2014). 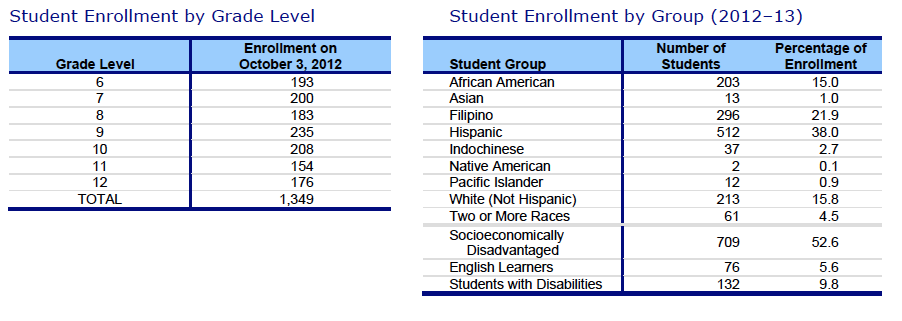 Student Enrollment by Grade and by Group SCPA has a diverse population with a large number of socioeconomically disadvantaged students. African American students 203, Filipino 296, Hispanic 512, White (non-Hispanic) 213. ELLs 76, and Students with Disabilities 132. 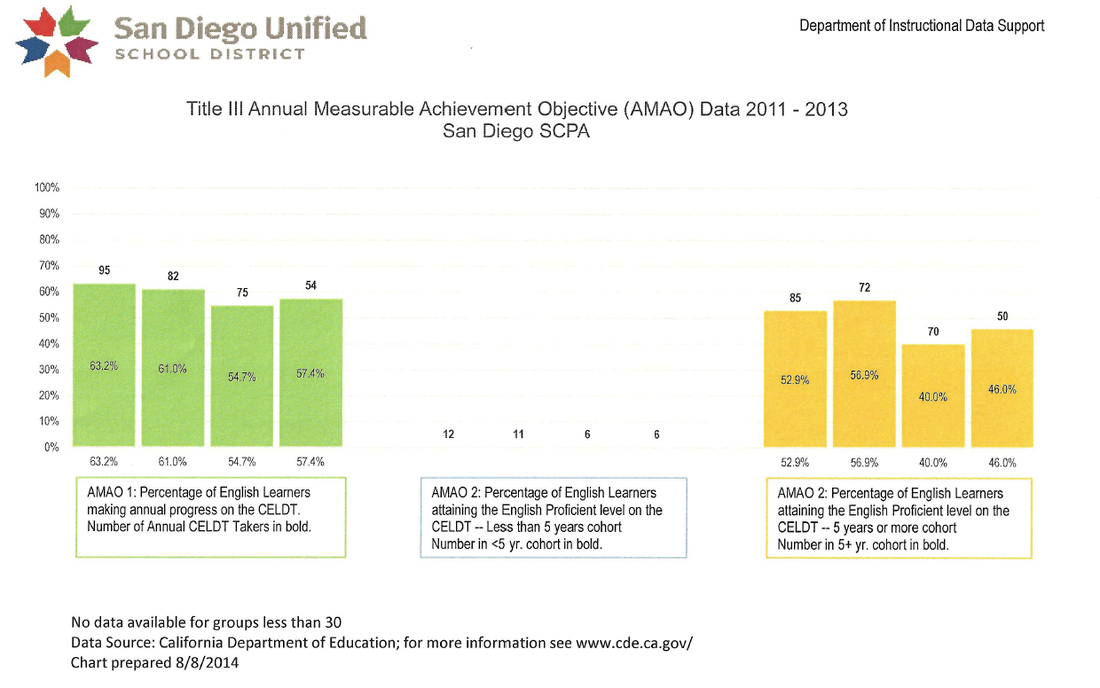 Title III Annual Measurable Achievement Objective (AMAO) Data 2011-2013 CELDT annual progress and attaining proficiency levels is fairly consistent with a slight decrease (need to pull 2014 CELDT data and breakdown by student groups). 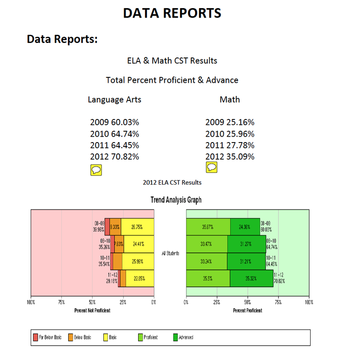 ELA & Math CST Data Trend Reports ELA CST results showed school-wide improvement from 64% proficient and advanced in 2011 to 71% proficient and advanced in 2012. Data pulled for 2013 shows ELA CST holding at 70%. Math CST results show a slight improvement from 2012 to 2013 with an increase from 36% to 38%. Data from 2011-2012 Demographic Group Focus (SCPA SPSA Report) showed improvement in all demographic groups except for African-American students who are 32.5% at or above proficient, ELL students who are 24.8% at or above proficient and socio-economically disadvantaged students who are 37.5% at or above proficient in Math. 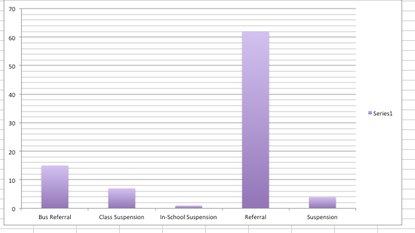 PBIS Site Collected Data on Students Grades 6-8 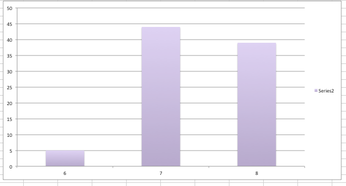 Referrals by Grade Level Grades 6-8 Positive Behavior Interventions and Support (PBIS) Data shows a high number of referrals for students in grades 6-8. Majority of the referrals are for grades 7 and 8th. 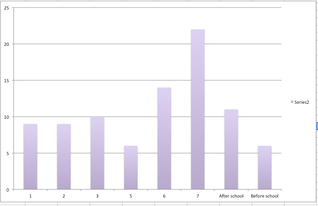 Periods and Times Incidents Occurred 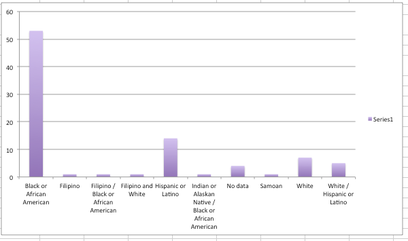 Students Groups Majority of students receiving referrals are African American 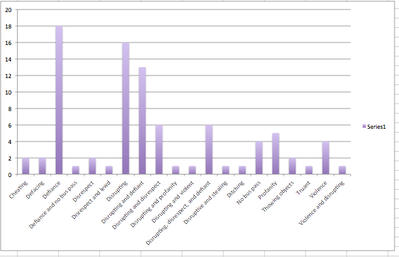 Reasons for Disciplinary Action and Referrals Majority of referrals were written for disruptive behavior or defiance. Questions that data sparked1. Why was there a decline in African American students meeting graduation UC A-G Criteria from 2011-2013? 2. Why are referrals and behavior incidents for middle school students, particularly grades 7 and 8 so high? 3. Why are the majority of the referrals from African American students? 4. Whether the intensive interventions put into place to support ELLs is working? These interventions include: Use of Learning Upgrade, Acuity, Rosetta Stone, and intensive and explicit small group work. According to SPSA goals, ELLs will improve performance from 33.1% to 66.7% on the CELDT and from 31% to 67.7% in the California Star test, and 66.1% of ELLs will score proficient or advanced in Math and ELA CSTs (Next Steps: Meet with ELD Coordinator to secure missing CELDT results, confirm, and assess data). 5. Given all of the interventions in Math, including a common prep period, increased tutoring, and development of an Action Research Committee to analyze data, clarify problems and create an action plan to implement, why have Math scores increased only slightly? Three priority needs1. Supporting student groups in grades 6-8 grade. 2. Monitoring and supporting English Language Learners (ELLs) 3. Continuing to work with target groups in Math. Which target group did you select to work with and whyThe PBIS program and data collection is new for our school this year and fits with SCPAs school-wide goal to improve our school climate and culture. Since the performance of our middle school students impacts our high school achievement, the Arts, and attrition rates at our school, this is an area where more attention is needed. Particularly increasing student engagement at the middle school level. Attendance for this group is good, but many do not have an interest in the Arts and we lose them by the end of the 9th grade. In terms of the school climate and culture at our school, the focus in the past was on the high school, both in terms of the Arts and the academics. Since last year, we are making an effort to validate our middle school students. We held an 8th grade promotion for the first time last year and this year we are increasing Arts performance opportunities at the middle school level and cultural opportunities and experiences for the middle school students.
|
AuthorWrite something about yourself. No need to be fancy, just an overview. ArchivesCategories |
 RSS Feed
Proudly powered by Weebly